This project is part of the Nanodegree offered by Udacity in Data Science and here I will present the results of my work.
This project analyzes some questions that will help decision makers take decisions to target their market in a more efficient way.
Business Understanding
1) Price trends:
– Price fluctuations for each month during the year.
– Price fluctuations for the Jan 2016 to Jan 2017 grouped by neighborhoods in Seattle
– Price fluctuations for the different property types.
2) Sentiment Analysis and Text Mining of the Reviews
In Particular:
– Identifying a quantified sentiment metric for an Airbnb comment based on text mining
– What is the relationship between reviews and neighborhoods
– What is the relationship between reviews and property types
3) Price prediction
Implemeting a Machine Learning algorithm to predict the price for new listings.
Results
Price Trends
We see that there is a clear fluctuation of the data where the summer months are the most expensive months in average and the winter months is the cheapest period (with a slight exception for the December month). Doing a quick search of the weather in Seattle for the different seasons, we see that the price fluctuations must be highly correlated with the weather forecast.

Then grouping the data for each of the neighborhoods in the Seattle area and calculating the averages. Below we can see the most expensive neighborhoods and the ones averaging above $150 per night for all of the data that we have which is from January 2016 to January 2017.
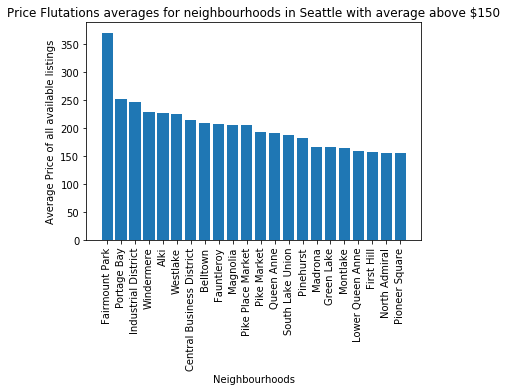
This can help us see what neighborhoods are the most valued ones and see if there is a link to the proximity to the city centre, tourists sights, restaurants. If we link this data to real state data, we could also see whether there is a correlation between both Airbnb night prices and the cost of owning property in different geographical areas of the city.
Finally, the below chart, shows what are the average prices for the different property types that are advertised on the Airbnb platform.

Sentiment Analysis and Text Mining of the Reviews
Next some analysis was done on the data retrieved from the comments that the guests left after their stays. Since the comments are left in the form of text. An algorithm was implemented in order to quantify how «good» or «bad» was the experience of the guests based on text mining of the comments.
Two metrics have been defined, namely polarity score and subjectivity score.
Polarity score is a metric going from -1 to 1, where -1 is perceived as the worst score and 1 is the best score of the users experience based on the comments.
Subjectivity score determines how subjective are the comments based on the type of words used.
For the purpose of this project we just look into more details of the polarity score and below we will show charts of what neighborhoods to guests give the «best» comments and followed by the least favorite ones.

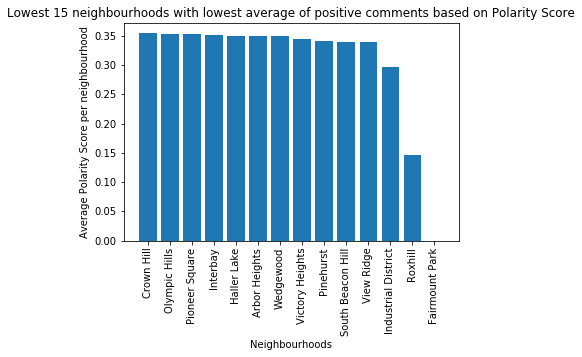
We can see for example the neighborhood of Fairmount Park has a score of 0 in average but this is due to the limited amount of data we have gathered for the study. So there is just one property that we have data for Fairmount Park and in fact the guests have left no reviews for this property.
3) Price prediction
Finally we have tested several algorithms in order to find the one with the best performance to predict the price of new listings based on all the features that are captured e.g. number of beds, how many people does the apartment accommodate, in which neighborhood it is, what amenities it has, etc.
Below we can see a table with the performances of each of the algorithms. The parameter to look at is how close is the R- Squared values of the test data is to 1 since this is what determines how well the algorithm performs and is capable of predicting the price. In other words, it defines how well our regression model is in predicting the price since it indicates the percentage of the variance in the dependent variables (price) that the independent variables (nº of beds, neighborhood, amenities, etc.) explain collectively.
| AdaBoost Regressor | Support Vector Machine Regressor | Decision Tree Regressor | Nearest Neighbor Regressor | |
| R-Squared Test Value | 0.514906 | 0.262458 | 0.514143 | 0.511793 |
| R-Squared Train Value | 0.581686 | 0.988625 | 0.600745 | 0.600745 |
We can see that the most interesting algorithms are the AdaBoost, Decision Tree and the Nearest Neighboor Regressor. However if we have to make a decision at this stage we would keep the Decision Tree algorithm since it has the highest performance based on the time it takes to run the algorithm. In other words, the computing power required is much lower than the AdaBoost algorithm .
Another observation, is that the support vector machine algorithm has a really high value on the training data set but not on the test dataset. This is due to over fitting of the algorithm.
Acknowledgements
https://statisticsbyjim.com/regression/interpret-r-squared-regression/
https://data-science-blog.com/en/blog/2018/11/04/sentiment-analysis-using-python/
https://medium.com/@erikgreenj/k-neighbors-classifier-with-gridsearchcv-basics-3c445ddeb657
